As a movie enthusiast, I have been keeping track of every film I watched over the years on Letterboxd, along with my personal ratings. This project documents how I transformed that raw data into a structured dataset, enriched it with additional information from IMDb, and prepared it for further analysis and visualization.
1. Data Extraction
Movies watched over several years were exported from Letterboxd in .txt format, including fields such as Date, Name, Year, Rating, and Letterboxd URI.Date, Name, Year, Letterboxd URI, Rating
The dataset was processed in Excel. Personal ratings were rescaled from Letterboxd’s 5-star system to IMDb’s 10-point scale (e.g., ×2). The table was simplified to include essential fields such as Name, Year, and Rating
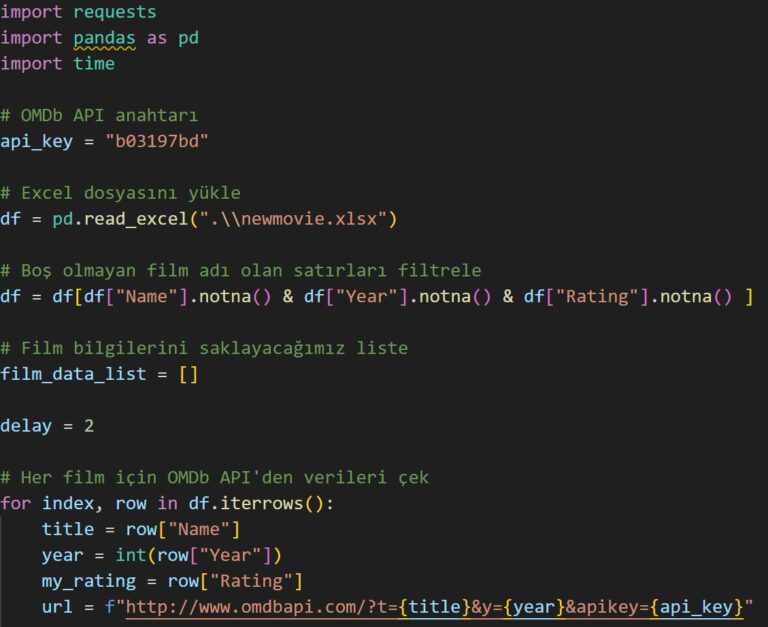
To enhance the dataset, a Python script was developed to connect to the OMDb API (IMDb data) and fetch additional attributes for each movie, including:
IMDb Rating
Country
Director(s)
Duration (runtime in minutes)
Language(s)
IMDb link
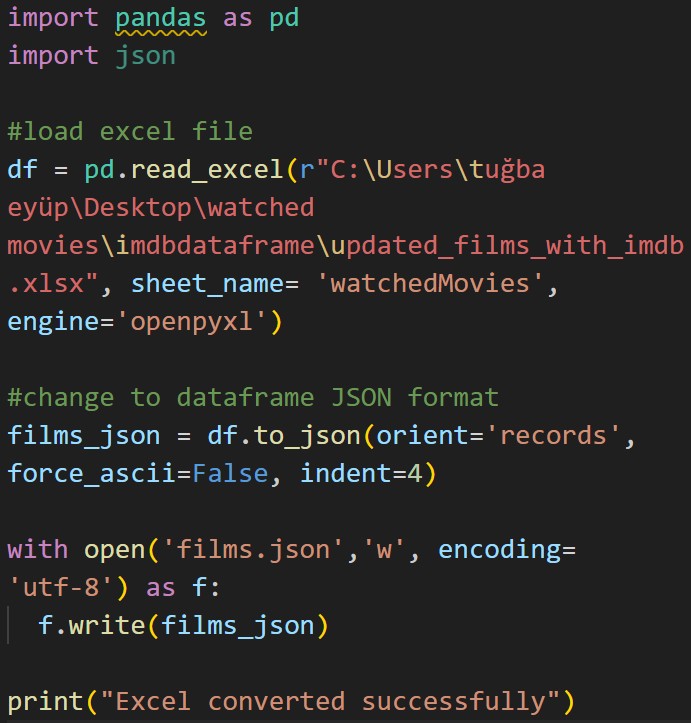
You can access the full code from the GitHub link or image below.
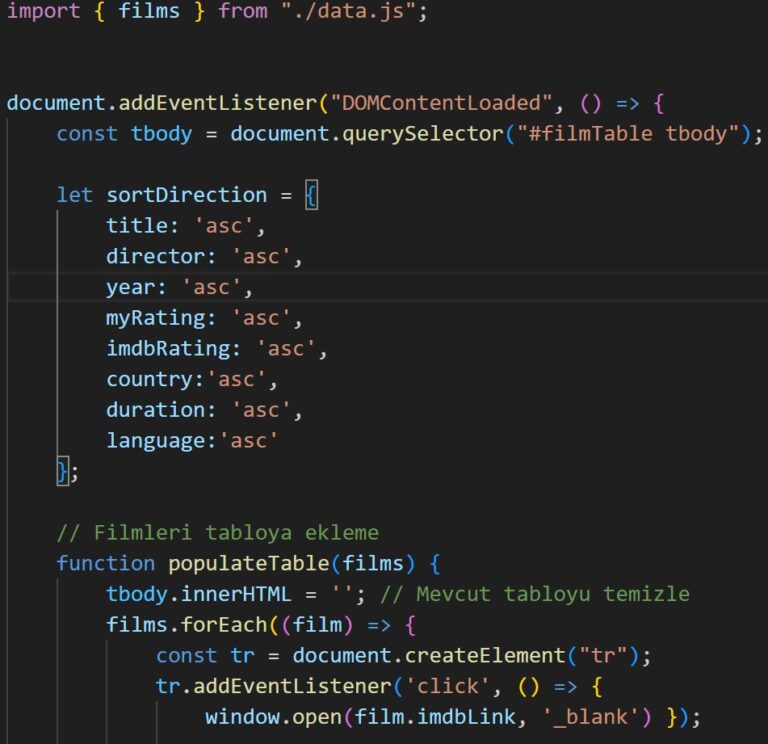
After preparing the dataset, a fully interactive table was created for visualization on a personal website, instead of embedding a static Excel or Power BI file. This was implemented using HTML, CSS, and JavaScript.
Key features implemented:
Sortable Columns: Clicking on a column header allows sorting the table in ascending or descending order.
Clickable Rows: Each row redirects to the corresponding IMDb page in a new tab.
Responsive Design: On mobile devices, some columns (e.g., Duration, Country, Language) are hidden for improved readability.
Custom Sorting on Load: By default, the table is pre-sorted by personal rating (highest to lowest).
Breadcrumb Adjustment: On this specific page, the global breadcrumb (“Home/…”) was disabled to avoid visual overlap with the
You can access the full code from the GitHub link or images below.