eyupatakanozkan

Build an interactive map to display visited countries.
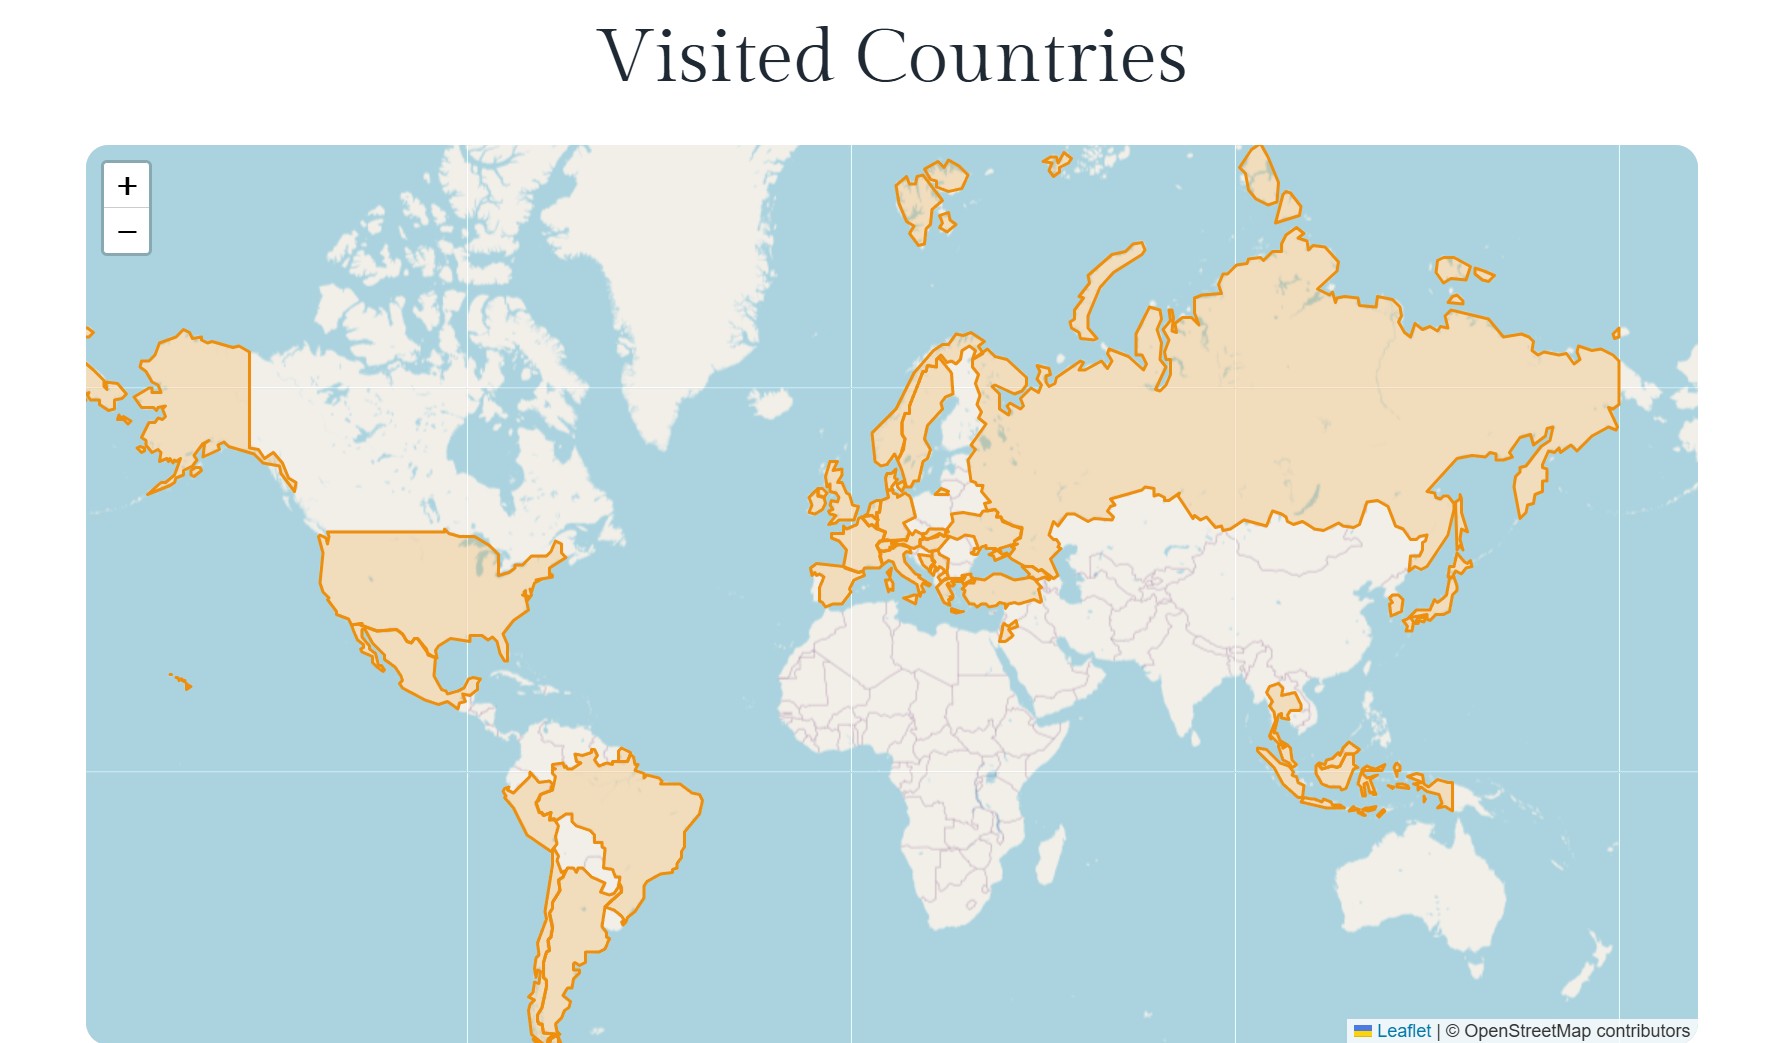
world map

ABOUT PROJECT

The purpose of this project was to create a more engaging way of showcasing the countries I have visited. Instead of using a simple text list, I wanted to visualize them on a world map where each country could be highlighted, interacted with, and linked to dedicated pages.
This project reflects both my personal travels and my technical skills in HTML, CSS, and JavaScript, as well as my ability to integrate external libraries and data formats into a web environment.

Click here to view the world map I published on my social site.

You can access the codes that used on this project  by clicking on the github logo below.

Project Steps

  1. Defining the Goal

    • Build an interactive map to display my visited countries.

    • Make the design visually appealing and interactive.

    • Ensure smooth integration with my WordPress portfolio site.

  2. Core Technologies

    • HTML: Provided the map container and project structure.

    • CSS: Styled the map with custom layouts, including border-radius for rounded edges and layering fixes (z-index).

    • JavaScript: Implemented all map logic, interactivity, and data handling.

    • Leaflet.js: External library used to create the interactive map.

    • GeoJSON: Data format used to represent world countries and their coordinates.

  3. Data Preparation

    • Downloaded a custom.geo.json file containing all world countries.

    • Converted it into a JavaScript object for easy integration.

    • Created a visitedCountries array to filter only the countries I’ve been to.

  4. Building the Map with JS

    • Initialized the Leaflet map with JavaScript.

    • Applied filtering logic so that only visited countries were highlighted.

    • Added tooltips on hover and clickable events on countries.

    • Configured clicks to redirect to specific WordPress category pages, opening them in a new tab.

  5. Styling & Interactivity

    • Styled the map with CSS (border-radius, responsive height, z-index adjustments).

    • Added hover effects in JavaScript: countries change to random colors when hovered.

    • Default visited countries were displayed in blue for consistency.

  6. Integration into WordPress

    • Placed the HTML map container in my “Projects” section.

    • Ensured that the project works dynamically within my portfolio site.

Result

  • An interactive and visually appealing world map built with HTML, CSS, and JavaScript.

  • Showcases my ability to combine front-end development with data visualization.

  • A scalable project where new countries can be easily added to the visited list.

GitHub Integration

Since the website includes a GitHub link, the following items were uploaded to a public repository:

You can access the full repository from the GitHub logo below.